- Part 1: Data cleaning and transformation
- Part 2: Exploratory data analysis and visualization
- Part 3: Machine learning model building for diabetes diagnosis
Tools/Languages : Pandas, Matplotlib, Machine Learning (Logistic regression model & Random Forest Classifier mode )


In this project, I have cleaned the raw data of diet from The World Health Organization's website using PostgreSQL and
then transformed the cleaned data for the purpose of the analysis.
Also, I have created data schema for relational database.
Tools/Languages : ETL, Relational Database, Table Schema, PostgreSQL

In this excel challenge, I completed the data analysis by using the below methods.
- Conditional formatting
- Pivot table
- Excel built-in functions like COUNTIFS() etc
- Statistical analysis like mean, median, max, min, variance, and standard deviation
- Manuplating the datatypes
- Filtering with various fields
- Visualizing the results using various types of graphs
Tools/Languages : Excel functions, Pivot table

In the data modeling section, inspected the CSV files, and then sketched an Entity Relationship Diagram (ERD) of the tables using QuickDBD.
In the data engineering section, used the provided information to create a table schema for each of the six CSV files.
- Specifing the data types
- Specifing primary keys.For the primary keys, verified that the column is unique. Otherwise, created a composite key which takes two primary keys to uniquely identify a row.
- Specifing foreign keys, and other constraints.
- Created the tables in the correct order to handle the foreign keys
- Imported each CSV file into its corresponding SQL table
Tools/Languages : ERD (entity relationship diagram), Relational Database, Table Schema

Created a script that loops through all the stocks for one year and outputs the following information:
- Yearly change from the opening price at the beginning of a given year to the closing price at the end of that year
- The percentage change from the opening price at the beginning of a given year to the closing price at the end of that year
- The total stock volume of the stock
- Make the appropriate adjustments to the VBA script to enable it to run on every worksheet (that is, every year) at once
Tools/Languages : VBA Scripting
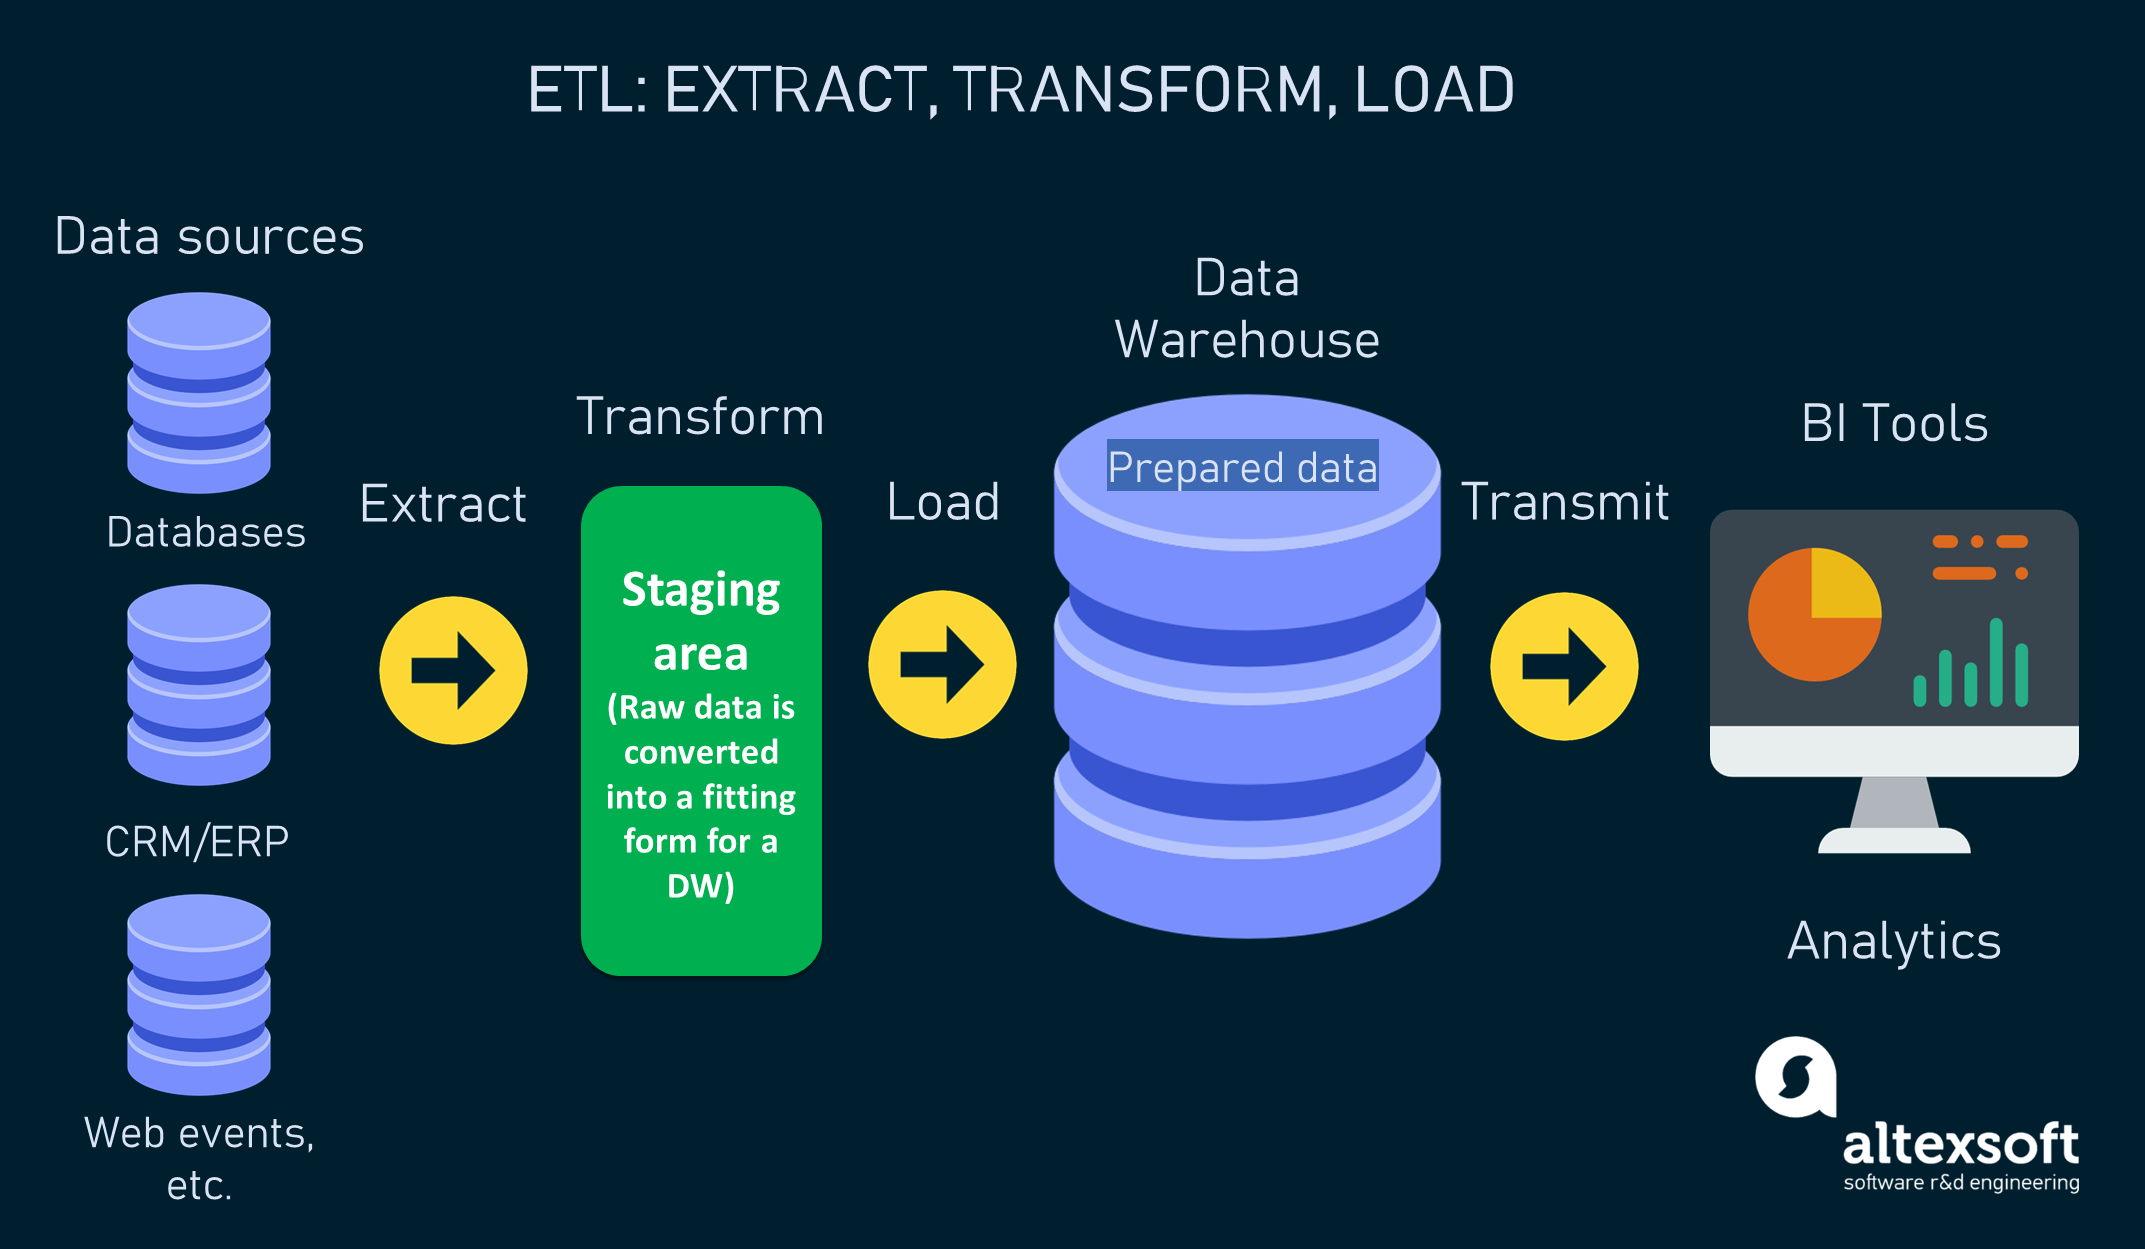
For this ETL project, I have built an ETL (Extract Transform Load) pipeline using Python, Pandas, and both Python dictionary methods and regular expressions to extract and transform the data. After transforming the data, created four CSV files and used the CSV file data to create an ERD and a table schema. Finally, uploaded the CSV file data into a Postgres database.
Tools/Languages: ETL, ERD, SQL schema, regular expressions, pandas, python dictionary

Used Python and SQLAlchemy to do a basic climate analysis and data exploration of the climate database. Specifically, used SQLAlchemy ORM queries, Pandas, and Matplotlib. After completing the EDA, designed a Flask API based on the queries that I developed.
Tools/Languages: SQLAlchemy (ORM Queries), Flask API, Jason, Python, Pandas, Matplotlib

Created a database using MongoDB, then updated the database and completed EDA.
Tools/Languages: NoSQL,MongoDB, PyMongo, Python
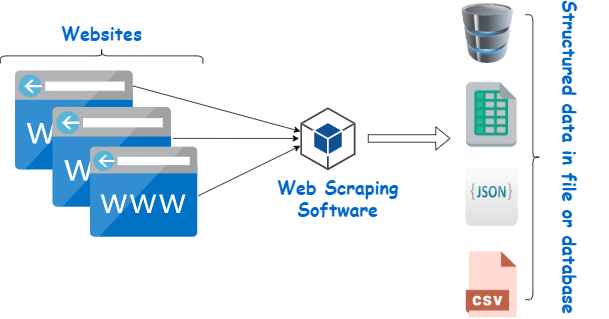
Identified HTML elements on a page by using inspect, identified their id and class attributes,
and used this knowledge to extract information via both automated browsing with Splinter and HTML parsing with Beautiful Soup.
Scraped various types of information from the web including HTML tables and recurring elements.
Tools/Languages: HTML, Splinter, Beautiful Soup, Python

Used Python requests, APIs, and JSON traversals to complete the analysis. Used the OpenWeatherMap API to retrieve weather data from the cities. Then, visualized the results using holoviews and hvplot.pandas.
Tools/Languages: API, api_keys, JSON traversals, holoviews, hvplot.pandas

Created a Python script to analyze the two datasets.
Tools/Languages: python, os, csv

Analyzed the district-wide standardized test results using student's math and reading scores,
as well as various information on the schools they attend. Then, aggregated the data to showcase obvious trends in school performance
Tools/Languages: Pandas, Jupyter notebook